Impact Monitors are now available for borrowing. Please register your team first and then email uavchallenge@gmail.com and ask to borrow an impact monitor.
1. Airborne Delivery Challenge 2018 Medical Package
The medical packages for the Airborne Delivery Challenge are X200-4 Impact Accelerometers manufactured by Gulf Coast Data Concepts. To learn the full details about the X200-4 Impact Accelerometer you can read it’s user manual at http://www.gcdataconcepts.com/GCDC_X200-4_User_Manual.pdf, but on this page we will explain how to use the impact monitor for the UAV Challenge.
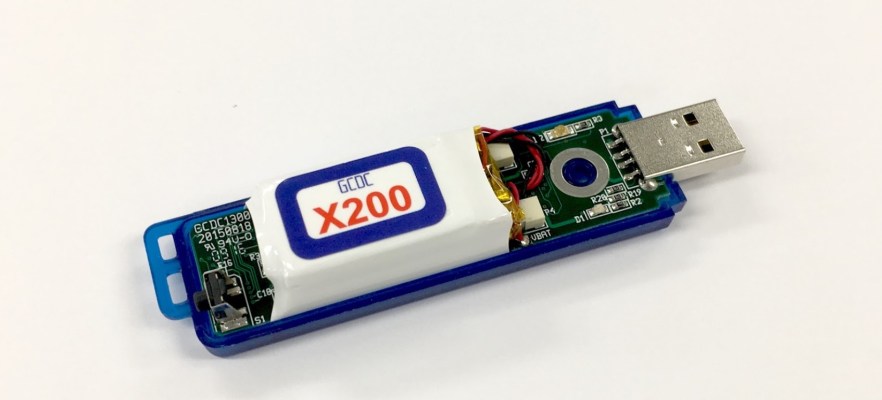
An impact monitor with the housing open
The impact monitor has 3 LEDs:
- A red LED on the top that lights when data is being written onto the microSD card in the impact monitor
- A blue LED on the top that blinks once per second when the impact monitor is running
- A red LED on the bottom that lights whenever the battery is being charged
The impact monitor is powered by a rechargeable LiPo battery which is charged when the the impact monitor is plugged into a USB port. When the battery is fully charged the red LED on the bottom will turn off. When plugged into a computer’s USB port the impact monitor appears to the computer in the same way as a USB memory stick. Files can be copied off or deleted just like normal. There is a recessed button at the end which is used to start and stop recording. The impact monitor measures and records the accelerations on the X, Y and Z axis. The directions of each axis are shown in the image below:

2. Starting a Recording
Starting a recording is as simple as pushing the recessed button. Use a probe such as a screwdriver to reach the button and push it and the top LEDs will flash briefly. After a few seconds the blue LED will begin to blink to show that the impact monitor is running. The top red LED will also flash whenever date is written.

Now, do something with the impact monitor! Shake it around. Throw it in the air and catch it. Drop it on the floor. To stop a recording you can either push the button again, but this time for a few seconds, or plug it into a computer. If the impact monitor has the normal UAV Challenge configuration, recording is stopped when it is plugged into a computer.
3. Viewing the Data
The data is recorded as a comma separated variable (CSV) file. Below is an example of what the data looks like if it is opened using a text editor. Viewing the data like this you can see the raw measurements from the accelerometer but it’s not very practical to look at lots of data this way. A better way to view the data is using a graph. Below we can see a simple test of the accelipen; shaking it, throwing and catching it and dropping it onto the floor.

4. Files and Folders
When the impact monitor is plugged into a computer it will appear to the operating system as a USB drive with the name X200-???? where ???? is the last 4 digits of the device’s serial number.
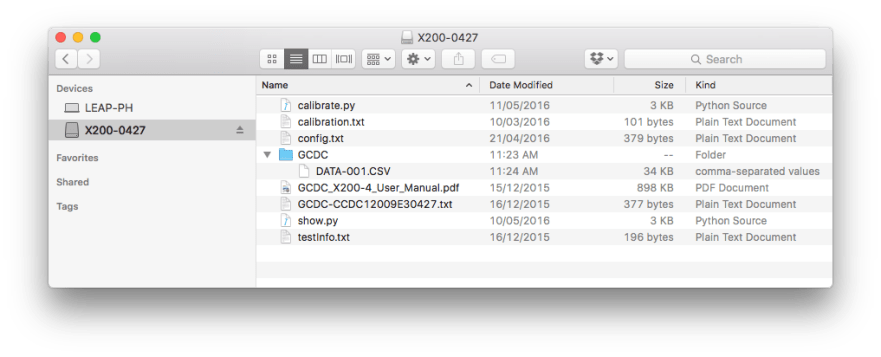
The figure above shows the standard files on an impact monitor (as viewed in OSX). They are:
- calibrate.py and show.py – python scripts that are discussed below
- calibrate.txt – a file generated by calibrate.py – discussed below
- config.txt – the configuration file that controls the recording of accelerations
- GCDC folder – the folder where data files are stored
- DATA-001.csv – a recorded data file
- GCDC_X200-4_User_Manual.pdf – the electronics user manual
- GCDC-serialnumber.txt and testinfo.txt – quality control test reports from the manufacturer
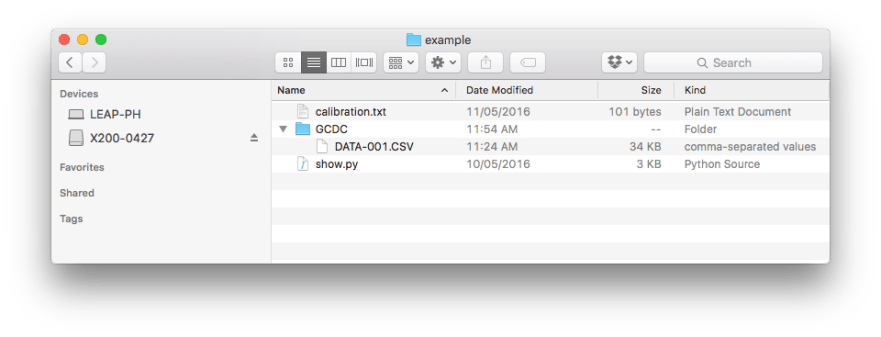
When using the data files they can be left on the impact monitor or copied to a working folder elsewhere so that the impact monitor can be removed from the computer. If you do copy the data files elsewhere the minimum you will need to copy is:
- calibration.txt
- GCDC folder
- The desired data files in the GCDC folder
- show.py
Your working folder should then look like in the figure below:
5. Python Scripts
There are many different ways that the data can be graphed. To make it easier for competitors the UAV Challenge organisers have a provided a relatively simple mechanism for viewing the data which will also be used by the judges of the Airborne Delivery Challenge. Another tool that could be used is Microsoft Excel which can import csv files and graph the data, but the number of data points in an impact monitor data file makes using Excel for this a bit slow and cumbersome.
Python is a widely used programming language that emphasises easy to read code and can be used to perform complex tasks with only a few lines of code. The UAV Challenge orgainsers have developed a short python script to convert the raw accelrometers measurements for a data file to Gs and plot them on a graph. This script should have been loaded on the impact monitor when it was sent by the UAV Challenge organisers. The scripts can also be found at https://bitbucket.csiro.au/projects/UAVC/repos/accelipen/browse
5.1 Installing Python
The impact monitor python scripts use python 2.7, which is installed by default on OS X and common Linux distributions such as Ubuntu. Windows user will need to install python to be able to run the supplied script. A straight forward way of installing python and the packages that are used by the script is using Anaconda. Anaconda is a distribution of python that includes python itself and many software packages for processing data. The Anacaonda install instructions at https://docs.continuum.io/anaconda/install should help.
5.2 Running show.py
The show.py script is run from the command line. The exact way will vary between operating systems.
5.2.1 OS X and Ubuntu

- Start the appropriate command line tool, Terminal on OS X or Console on Ubuntu
- Change directory either to the impact monitor or to your working folder where you have copied data to a. On OS X the impact monitor will be located under the /Volumes directory as in the example below. On Ubuntu the impact monitor will be mounted under /media
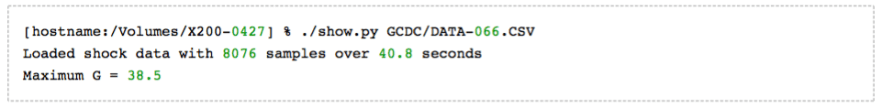
- Run show.py with no input arguments as in the example below
- As no input argument was used the show.py script looks for the most recent data file in the GCDC folder
- The data from the file is loaded and converted from raw acceleration values to Gs
- A plot of the accelerations is opened in a new window
- Once the plot window is closed the script finishes
- show.py can also be given the name of the data file to use
5.2.2 Windows

- Start Command Prompt
- Change drive to the impact monitor, by typing “e:” if the impact monitor is E drive
- Run show.py with no input argument by typing “python show.py”
- As no input argument was used the show.py script looks for the most recent data file in the GCDC folder
- The data from the file is loaded and converted from raw acceleration values to Gs.
- A plot of the accelerations is opened in a new window.
- Once the plot window is closed the script finishes.
5.3 Displayed Plots
Shown below is an example displayed graph from running show.py. In the figure we can see two subplots, the upper plot showing the acceleration data from all 3 axes of the impact monitor and the lower plot showing the sum of the axes. In the bottom left of the window there are icons for tools to manipulate the graph. The zoom tool, highlighted with an arrow, allows you to zoom in on an area of interest. The yellow box in the upper subplot was dragged out using the zoom tool.

When the mouse button is released after clicking and dragging out a box using the zoom tool the graph is re- scaled so that the selected box fills the graph. The figure below shows the graph after zooming on the yellow box in the figure above.
 The figure below again shows the graph after zooming on the yellow box in the figure above. The other tool icons let you reset the graph, undo the actions you’ve done and move the plot around.
5.4 Calibration
The accelerometers in the accelipen will usually have a small offset from zero. This means that even when the accelipen is not experiencing an accelerating force the measurement won’t be exactly zero. To reduce the effect of this the accelipen is calibrated and a file, calibration.txt, is stored on the accelipen that records the offset from zero for each axis. The show.py script uses the calibration to show the data with the offsets removed.
5.4.1 Calibration Process
When the impact monitor was sent to you it will have already had a calibration file on it, so you shouldn’t normally need to do the calibration process yourself. In case the file is deleted or you think it’s wrong you can re-do the calibration.
To perform the calibration we need to have each axis of the accelerometer at its resting state. Gravity will mean there’s always a force acting on the impact monitor so we can’t easily calibrate all axis at the same time, but we can do them separately by changing the orientation.
To record a data file for calibration:
- Setup the impact monitor so that it is as vertical as possible, with the USB connector pointing downwards. i. e. the positive X-axis . It won’t normally balance on the connector so you will need to use clamp, vice or something with a vertical USB socket, such as a USB hub, to hold it.
- Start the impact monitor running by pushing the recessed button.
- Wait 30 seconds, ensuring you don’t bump the impact monitor or the surface it’s on while you’re waiting.
- Quickly move the impact monitor onto a flat, level surface with the two LEDs to the top.
- Wait another 30 seconds, again making sure not to bump it.
- Stop the impact monitor by pushing the button or plug it into a computer.
The data file that was just recorded can then be used by the calibration.py script to generate the calibration. txt file.
- Change drive to the impact monitor or change directory to your working folder.
- Run the calibration script, giving the data file recorded using the steps above as the input filename argument.
- A plot of the data for each axis will be shown in a new window.
- There are two black vertical lines on each plot. The data between these times will be used to calculate the average offset.
- Look at the plots and observe check that the plot is flat between the black lines and there is no indication that the impact monitor was moved or bumped at the wrong moment
- Close the plot.
- On the command prompt you will be asked whether or not to save the calibration.
- If the plot was OK type “y” and press enter to save a new calibration file.
- If you don’t want to save the calibration just press enter.
The figure below shows the data plotted by calibrate.py:

This figure shows running calibrate.py and the output it gives on the command prompt.

6. Impact Accelerometer Configuration
The impact monitor has a configuration file that controls how the data is recorded. The UAV Challenge organisers will have initially set the configuration file to the standard settings for the competition. It is possible to change the configuration but it is important to realise that changing the sample rate can change the magnitude of the recorded accelerations in some circumstances. The raw acceleration values are processed by a digital filter before they are recorded. This filter helps to reduce noise in the data. If the sample rate is configured to 800Hz or above the digital filter is disabled and very brief accelerations that would normally be filtered out may become visible. Very short impacts such as those directly onto a concrete floor may show a much higher acceleration when recording at 800Hz and above than when recording at the standard 200 Hz.
With this warning in mind, it can still be interesting to conduct tests at high sample rates. You may be able to see changes in acceleration during the impact that can help you understand what’s happening. Just remember to put the sample rate back to 200Hz when you are ready to test normally again.
If you do wish the change the configuration you should refer to the manufacturer’s manual http://www. gcdataconcepts.com/GCDC_X200-4_User_Manual.pdf and follow their recommendation to not use windows Notepad for editing the configuration file.
7. Usage Tips
- Do a few simple test drops with the impact monitor, and then look at the data to learn how to use it first.
- Start testing your impact protection from the ground, don’t go straight to dropping from your UAV. Drop it from a height or throw it onto the floor.
- Only when you think the system is working from the ground should you try it from the UAV. It’s much quicker to climb a set of stairs and drop the package than to go to a flying field.
- Take notes of what you do in each test, and which data file the test generated so you can go back to it later.
- Repeat the same drop a few times in each test as there will be some variation. You don’t want to base your design on an unusual drop.
- Pay attention to the aerodynamics and balance of your delivery package. If you have a great impact protection system but it lands backwards, it probably won’t work so well.
